PHASTEST Statistics
Quick Links
Table 1: PHASTEST's performance upgradesTable 2: Feature comparison between PHAST, PHASTER and PHASTEST
Table 3: PHASTEST's evaluation (summary)
Table 4: PHASTEST's evaluation on GenBank annotated genomes
Table 5: PHASTEST's evaluation on unannotated genomes
Table 6: Comparison of Numbers of Proteins Annotated by Lite (Swissprot) and Deep (PHAST-BSD) Annotation Mode
Figure 1: Numbers of correct and false positive phage regions for E. coli
Figure 2: Performance Comparison of Prodigal and GLIMMER
Table 1: PHASTEST's performance upgrades
| Cumulative set of performance enhancements | BLAST vs. phage DB runtime (s) | BLAST vs. bacterial DB runtime (s) | Total runtime on GenBank annotated genome (s) | Total runtime on unannotated genome (s) |
|---|---|---|---|---|
| PHAST (baseline) current DBs, no other upgrades | 191 | 576 | 270 | 899 |
| PHASTER (Past) - 2016 Data | 47 | 48 | 126 | 227 |
| PHASTER (Baseline) - Current DBs, no other upgrades | 116 | 83 | 162 | 277 |
| PHASTEST (Upgrade 1) - BLAST+ parameter adjustment | 82 | 82 | 144 | 229 |
| PHASTEST (Upgrade 2) - Whole-sequence Prodigal | 81 | 71 | 141 | 201 |
| PHASTEST (Upgrade 3) - Parallel Diamond* | 84 | 124 | 266 | 118 |
| PHASTEST (Upgrade 4) - Swissprot DB* | 80 | 64 | 110 | 195 |
Details of PHASTEST’s performance upgrades, and its impact on 5.5 Mbp test genome (Escherichia coli O157:H7,GenBank accession NC_002655). Pipeline configuration capable of full genome-wide annotation is marked with (*).
Table 2: Feature comparison between PHAST, PHASTER and PHASTEST
| Feature | PHAST (as of Jan 2011) | PHASTER | PHASTEST |
|---|---|---|---|
| Viral sequence database | ~45,000 sequences | ~187,000 sequences | ~410,000 sequences |
| Bacterial sequence database | ~4 million sequences | ~9 million sequences, streamlined through CD-HIT filtering | Swissprot database, ~560,000 sequences |
| Computing cluster | 32 CPU cores | 112 CPU cores | 116 CPU cores |
| BLAST | Legacy version 2.2.16 | BLAST+ version 2.3.0+ | BLAST+ version 2.3.0+, Diamond v2.0.14 |
| Cluster use optimization | Rudimentary | Smart partitioning of query sequences and target bacterial DB; optimized execution parameters | Optimized execution parameters |
| Front-end server | Shared, single CPU | 50% faster, dedicated | Dedicated 4 CPU cores |
| Front-end website | Perl and CGI | Ruby on Rails | Ruby on Rails |
| Genome viewer | Adobe Flash | JavaScript, AngularPlasmid and D3 | CGView.js |
| Queuing system | Flat file | Uses Sidekiq for threading submissions | Uses Sidekiq for threading submissions |
| Recall previous user submissions | Bookmark page | “My Searches” feature or bookmark | "My Searches" feature or bookmark |
| Pre-computed genome results for quick query searching | 0 | >14,000 | >14,000 |
| Retrieve previously annotated genome results | GenBank accession or GI number only | GenBank accession, GI number, or full sequence | GenBank accession, GI number, or full sequence |
| Metagenomic data handling | NA | For raw sequence files only | For raw sequence files and whole-genome shotgun GenBank records |
| Annotation Target | Phage region only | Phage region only | Full genome |
Table 3: PHASTEST's evaluation (summary)
| PHAST (2011) | PHASTER (2016) | PHASTEST (2022) | ||||
|---|---|---|---|---|---|---|
| Input data | GenBank annotated genome | Sequence only | GenBank annotated genome | Sequence only | GenBank annotated genome | Sequence only |
| Sensitivity | 85.4% | 79.4% | 86.9% | 85.0% | 87.6% | 85.0% |
| Positive predictive value (PPV) | 94.2% | 86.5% | 91.0% | 87.3% | 91.4% | 91.2% |
| Prophages annotated in evaluation set | 267 | 267 | 267 | 267 | 267 | 267 |
| Prophages matched | 228 | 212 | 232 | 227 | 234 | 227 |
| Predicted prophages not present in evaluation set | 14 | 33 | 23 | 33 | 22 | 22 |
| Predicted prophages not in the evaluation set with evidence suggestive of being true prophages | N/A | N/A | 12 | 11 | 8 | 7 |
| Adjusted sensitivity | N/A | N/A | 87.5% | 85.6% | 88.1% | 85.4% |
| Adjusted PPV | N/A | N/A | 95.7% | 91.5% | 94.5% | 94.0% |
Comparison of accuracy between the PHAST (2011), PHASTER (2016), and PHASTEST (2022). Evaluation was performed against manual prophage annotations in 54 bacterial genomes from Casjens, S. (2003) Molecular Microbiology, 49, 277-300. Because these manual annotations are a number of years old, predicted prophages were manually inspected, and it was determined that PHASTER and PHASTEST finds good evidence that several of these are in fact true prophages (these are marked below in Tables 4 and 5). Once the evaluation standard was adjusted to count these prophages as true positives, adjusted sensitivity and PPV values were calculated (last two rows).
Table 4: PHASTEST's evaluation on GenBank annotated genomes
| Organism | Reference | PHAST | PHASTER | PHASTEST |
|---|---|---|---|---|
| >NC_000962, Mycobacterium tuberculosis H37Rv, 4411532 bp | 2970551-2981576 | 2970065-2983874 | 2970063-2983874 | 2970063-2984654 |
| 1780643-1788505 | 1780643-1788505 | 1766989-1788505 | 1766987-1788505 | |
| >NC_000913, Escherichia coli K12, 4639675 bp | 262552-296320 | 262124-296432 | 262898-297206 | 262898-297719 |
| 2464567-2475651 | 2464378-2475651 | 2465301-2477629 | 2465301-2477629 | |
| 2754181-2775804 | 2753821-2780748 | 2754896-2777782 | 2746434-2777782 | |
| 564038-584856 | 563980-585282 | 564755-586057 | 564755-586057 | |
| 1410024-1432281 | 1404587-1432838 | 1395952-1435051 | 1395952-1435051 | |
| 1196090-1210402 | 1191881-1218961 | 1196867-1216671 | 1196867-1216671 | |
| 1631063-1650732 | 1631063-1662537 | 1619557-1656744 | 1619557-1656744 | |
| 2556793-2563354 | False Negative | False Negative | 2558575-2567625 | |
| 2064329-2076158 | False Negative | False Negative | 2068952-2082547 | |
| False Positives | 4505466-4540762 | 4491197-4548442 | 4491197-4548442 ** | |
| False Positives | n/a | 3716547-3722049 | n/a | |
| >NC_003112, Neisseria meningitidis MC58, 2272360 bp | ||||
| 1001560-1005455 | 998362-1007364 | False Negative | False Negative | |
| 1099910-1133980 | 1101164-1133760 | 1101164-1133760 | 1101164-1133760 |
Detailed evaluation results for PHAST (2011) and PHASTER (2016) run on GenBank annotated genomes. Evaluation was made against manual prophage annotations in 54 bacterial genomes from Casjens, S. (2003) Molecular microbiology, 49, 277-300. Prophages predicted by PHASTER that were absent in the evaluation set were manually inspected, and several (marked below with **) were deemed to have good evidence of being true prophages rather than being false positives.
For statistics on more organisms click here.Table 5: PHASTEST's evaluation on unannotated genomes
| Organism | Reference | PHAST | PHASTER | PHASTEST |
|---|---|---|---|---|
| >NC_000962, Mycobacterium tuberculosis H37Rv, 4411532 bp | 2970551-2981576 | 2970065-2980835 | 2970063-2980833 | 2970063-2984654 |
| 1780643-1788505 | False Negative | 1766987-1788115 | 1766987-1788487 | |
| >NC_000913, Escherichia coli K12, 4639675 bp | 262552-296320 | False Negative | False Negative | False Negative |
| 2464567-2475651 | False Negative | 2465301-2477629 | 2465301-2477629 | |
| 2754181-2775804 | False Negative | False Negative | False Negative | |
| 564038-584856 | 563980-585282 | 564755-586057 | 564755-586057 | |
| 1410024-1432281 | 1409925-1432985 | 1411899-1434959 | 1411969-1434812 | |
| 1196090-1210402 | 1197865-1215896 | 1198640-1216671 | 1198640-1216671 | |
| 1631063-1650732 | 1616881-1650732 | 1627517-1644304 | 1618855-1653915 | |
| 2556793-2563354 | False Negative | False Negative | False Negative | |
| 2064329-2076158 | False Negative | False Negative | False Negative | |
| False Positives | n/a | 3716547-3722049 | n/a | |
| >NC_003112, Neisseria meningitidis MC58, 2272360 bp | ||||
| 1001560-1005455 | 998266-1007364 | False Negative | False Negative | |
| 1099910-1133980 | 1099110-1133760 | 1101164-1133966 | 1098337-1133966 | |
| False Positives | 916111-930967 | 916109-929811 | n/a |
Detailed evaluation results for PHAST (2011) and PHASTER (2016) run on unannotated genome sequences i.e. not genbank annotated (only the sequence is used). Evaluation was made against manual prophage annotations in 54 bacterial genomes from Casjens, S. (2003) Molecular microbiology, 49, 277-300. Prophages predicted by PHASTER that were absent in the evaluation set were manually inspected, and several (marked below with **) were deemed to have good evidence of being true prophages rather than being false positives.
For statistics on more organisms click here.Table 6: Comparison of Numbers of Proteins Annotated by Lite (Swissprot) and Deep (PHAST-BSD) Annotation Modes
| Sample | Swissprot Hits | Swissprot Misses | PHAST-BSD Hits | PHAST-BSD Misses |
|---|---|---|---|---|
| NC_000907.1 | 1647 | 22 | 1666 | 3 |
| NC_000913.3 | 3955 | 28 | 3959 | 24 |
| NC_000962.3 | 2832 | 938 | 3763 | 7 |
| NC_000964.3 | 3698 | 48 | 3737 | 9 |
| NC_002488.3 | 1174 | 574 | 1748 | 0 |
Comparison of numbers of non-phage proteins annotated via PHASTEST's lite mode (using Swissprot database) and deep mode (using PHAST-BSD database). Swissprot Misses denote numbers of proteins present in deep annotation mode but not found in the lite annotation, whereas PHAST-BSD Misses denote numbers of proteins present in lite annotation but not found in deep annotation mode.
For statistics on more organisms click here.Figure 1: Numbers of correct and false positive phage regions for E. coli
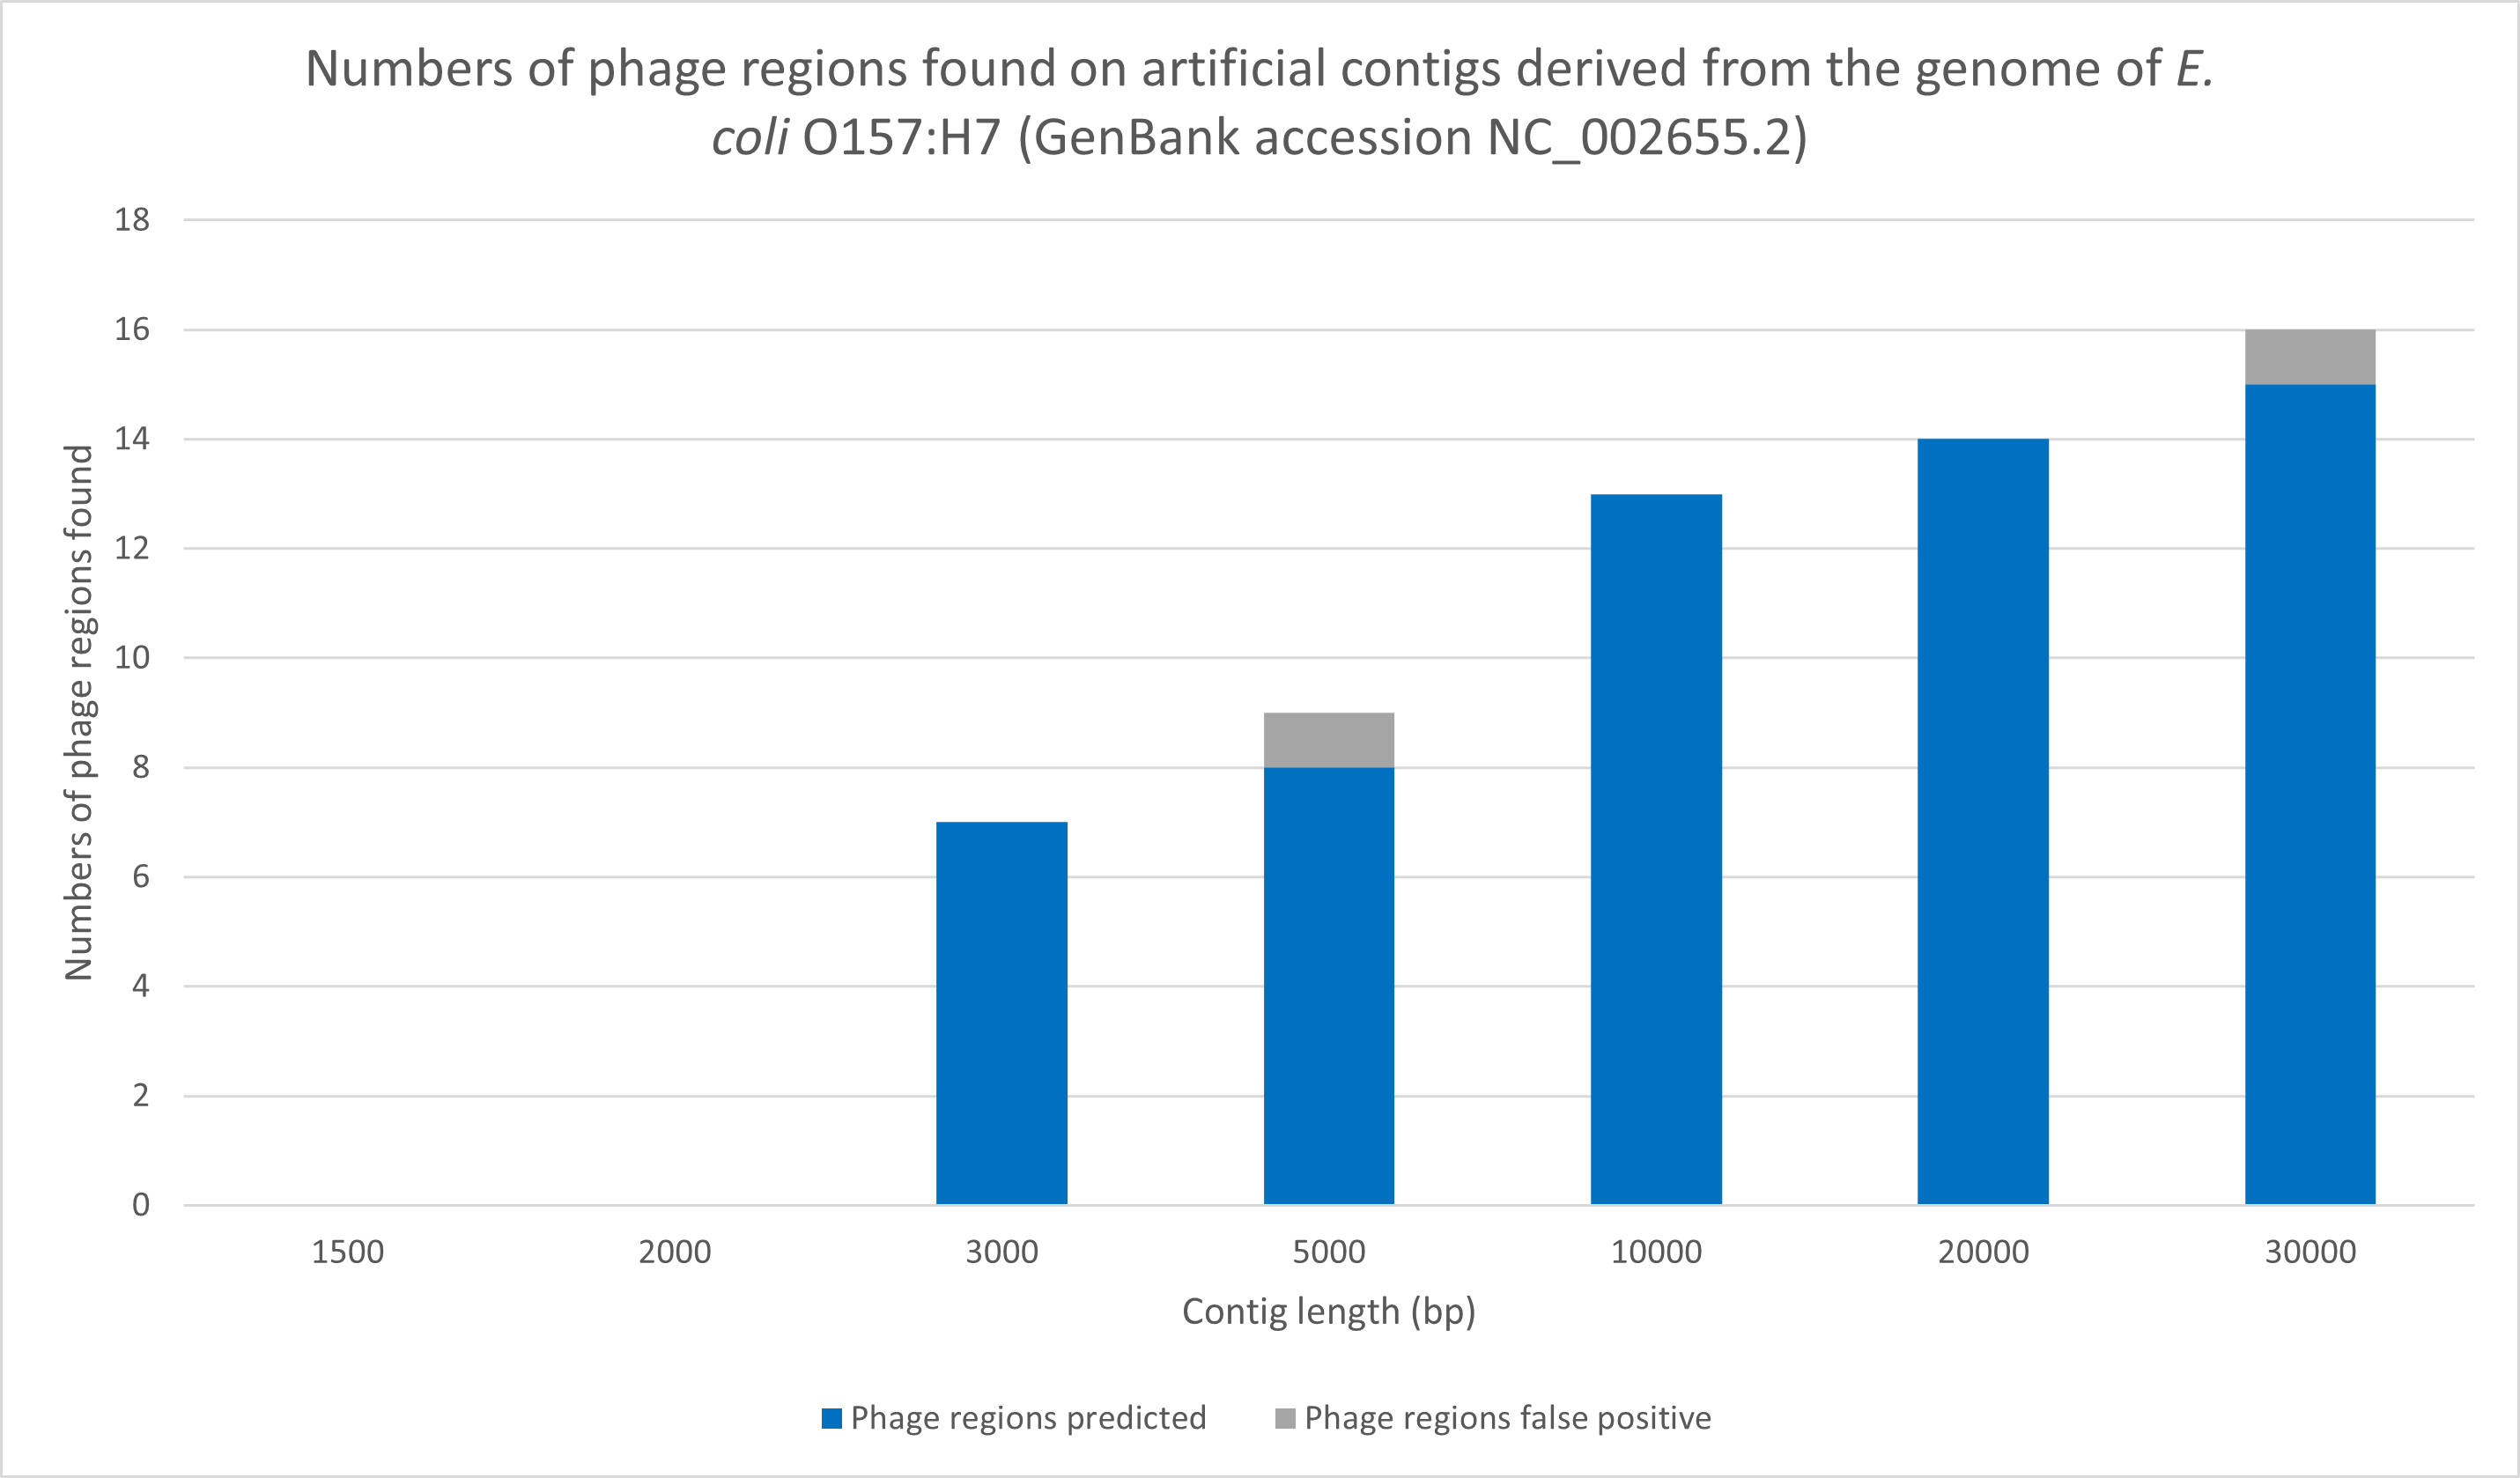
Numbers of true and false positive phage regions for E. coli O157:H7 (NC_002655.2) contig inputs of varying length. Graph shows numbers of phage regions correctly identified relative to the E. coli O157:H7 full sequence annotation result. E. coli O157:H7 full sequence is predicted to possess 15 phage regions total.
Figure 2: Performance Comparison of Prodigal and GLIMMER
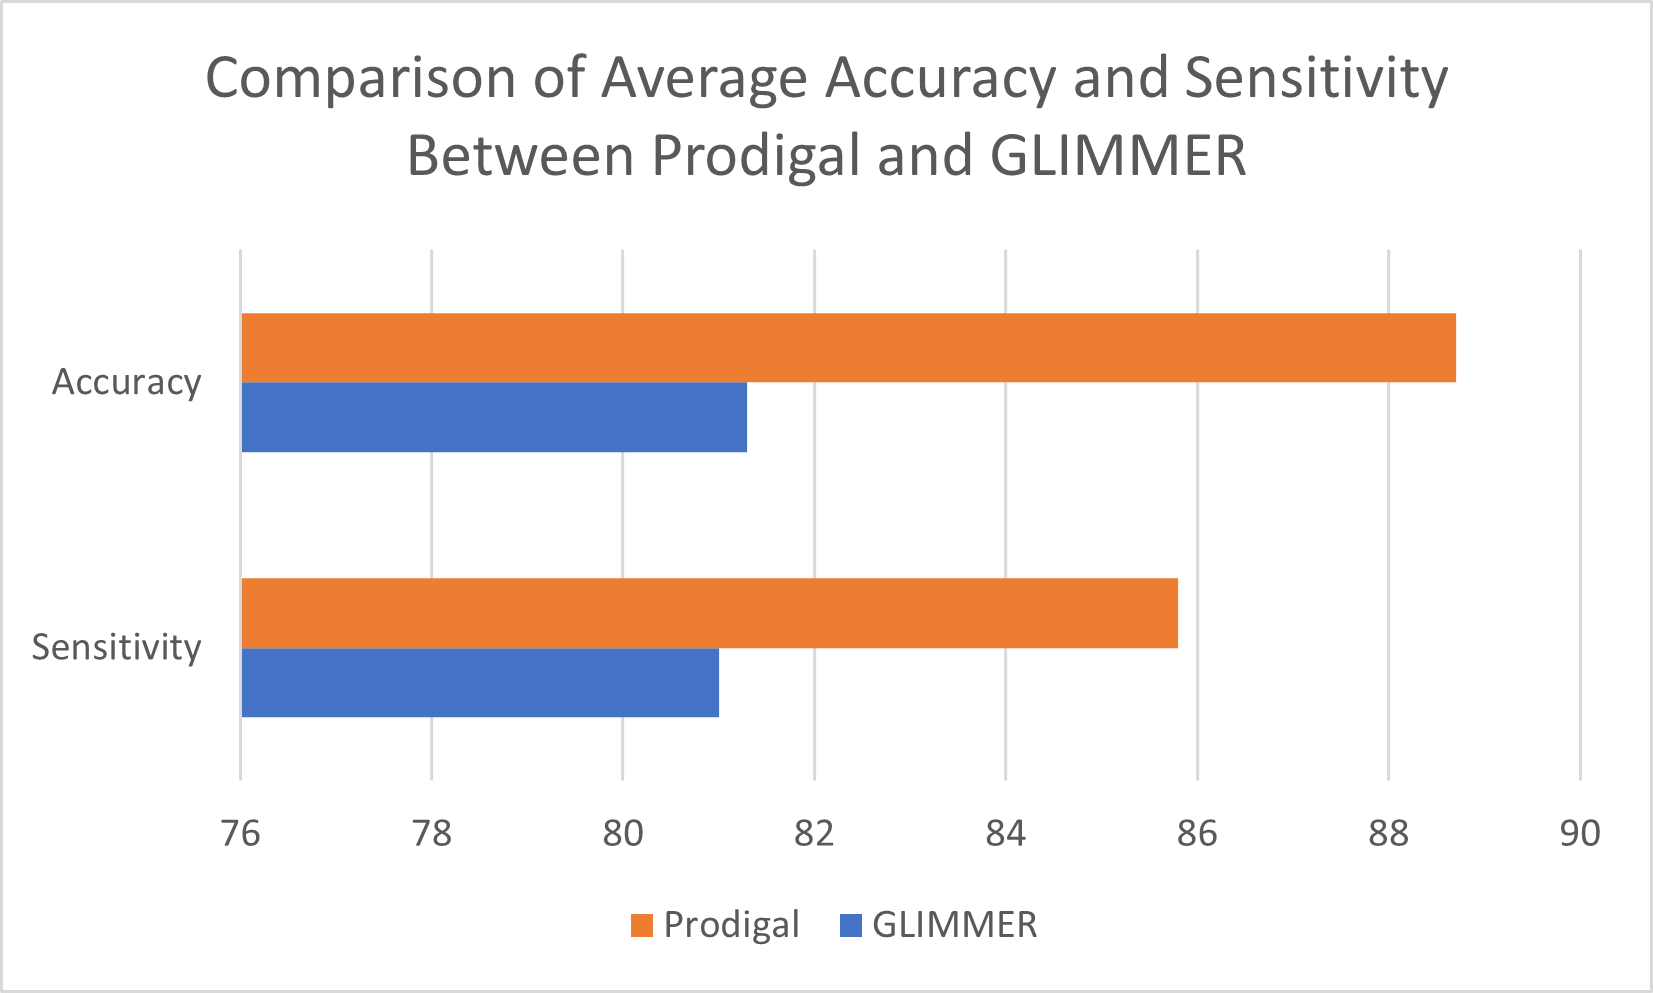
Accuracy comparison between Prodigal (used in PHASTEST) and parallel GLIMMER (used in PHASTER). Both programs were provided with FASTA format sequence input of 54 genome samples outlined in the table. Result of the ORF prediction was compared against pre-annotated CDS regions outlined in Genbank records of each genome. Sensitivity formula follows (amount of correct region prediction / total CDS identified in Genbank record), whereas accuracy was determined by (amount of correct predictions / (correct predictions + false positives)).
For detailed statistics on more organisms click here.